Overview
The package is divided into two broad ranges of functionalities:
Individual Pipeline: You use it for a single participant to process your raw data.
Group Pipeline: You use it when you have multiple participants, and you have processed them through the Individual Pipeline.
Below, we offer a quick overview of the main functionalities.
Data Collection
When one wants to establish the validity of a wearable, let’s say a smartwatch, that records heart rate and heart rate variability, they should use a “ground truth” device. This is usually a gold-standard electrocardiography (ECG) that measures HR and HRV accurately.
Note: We call this gold-standard a “criterion” device in our pipeline.
Then, a participant wears this ECG, together with the smartwatch, and starts recording data simultaneously. It is beneficial if we test the subject in various conditions, so we get a better sense of how well the device works.
Usually, validating multiple devices at once is a cumbersome task, requiring a lot of data preparation, processing, different alignments, etc. A powerful feature in ``wearablehrv`` is that it does not matter how many devices in how many conditions you want to test a participant! You just record your data, and the pipeline walks you through this data to the final decision on whether a device is accurate compared to the ground truth or not.
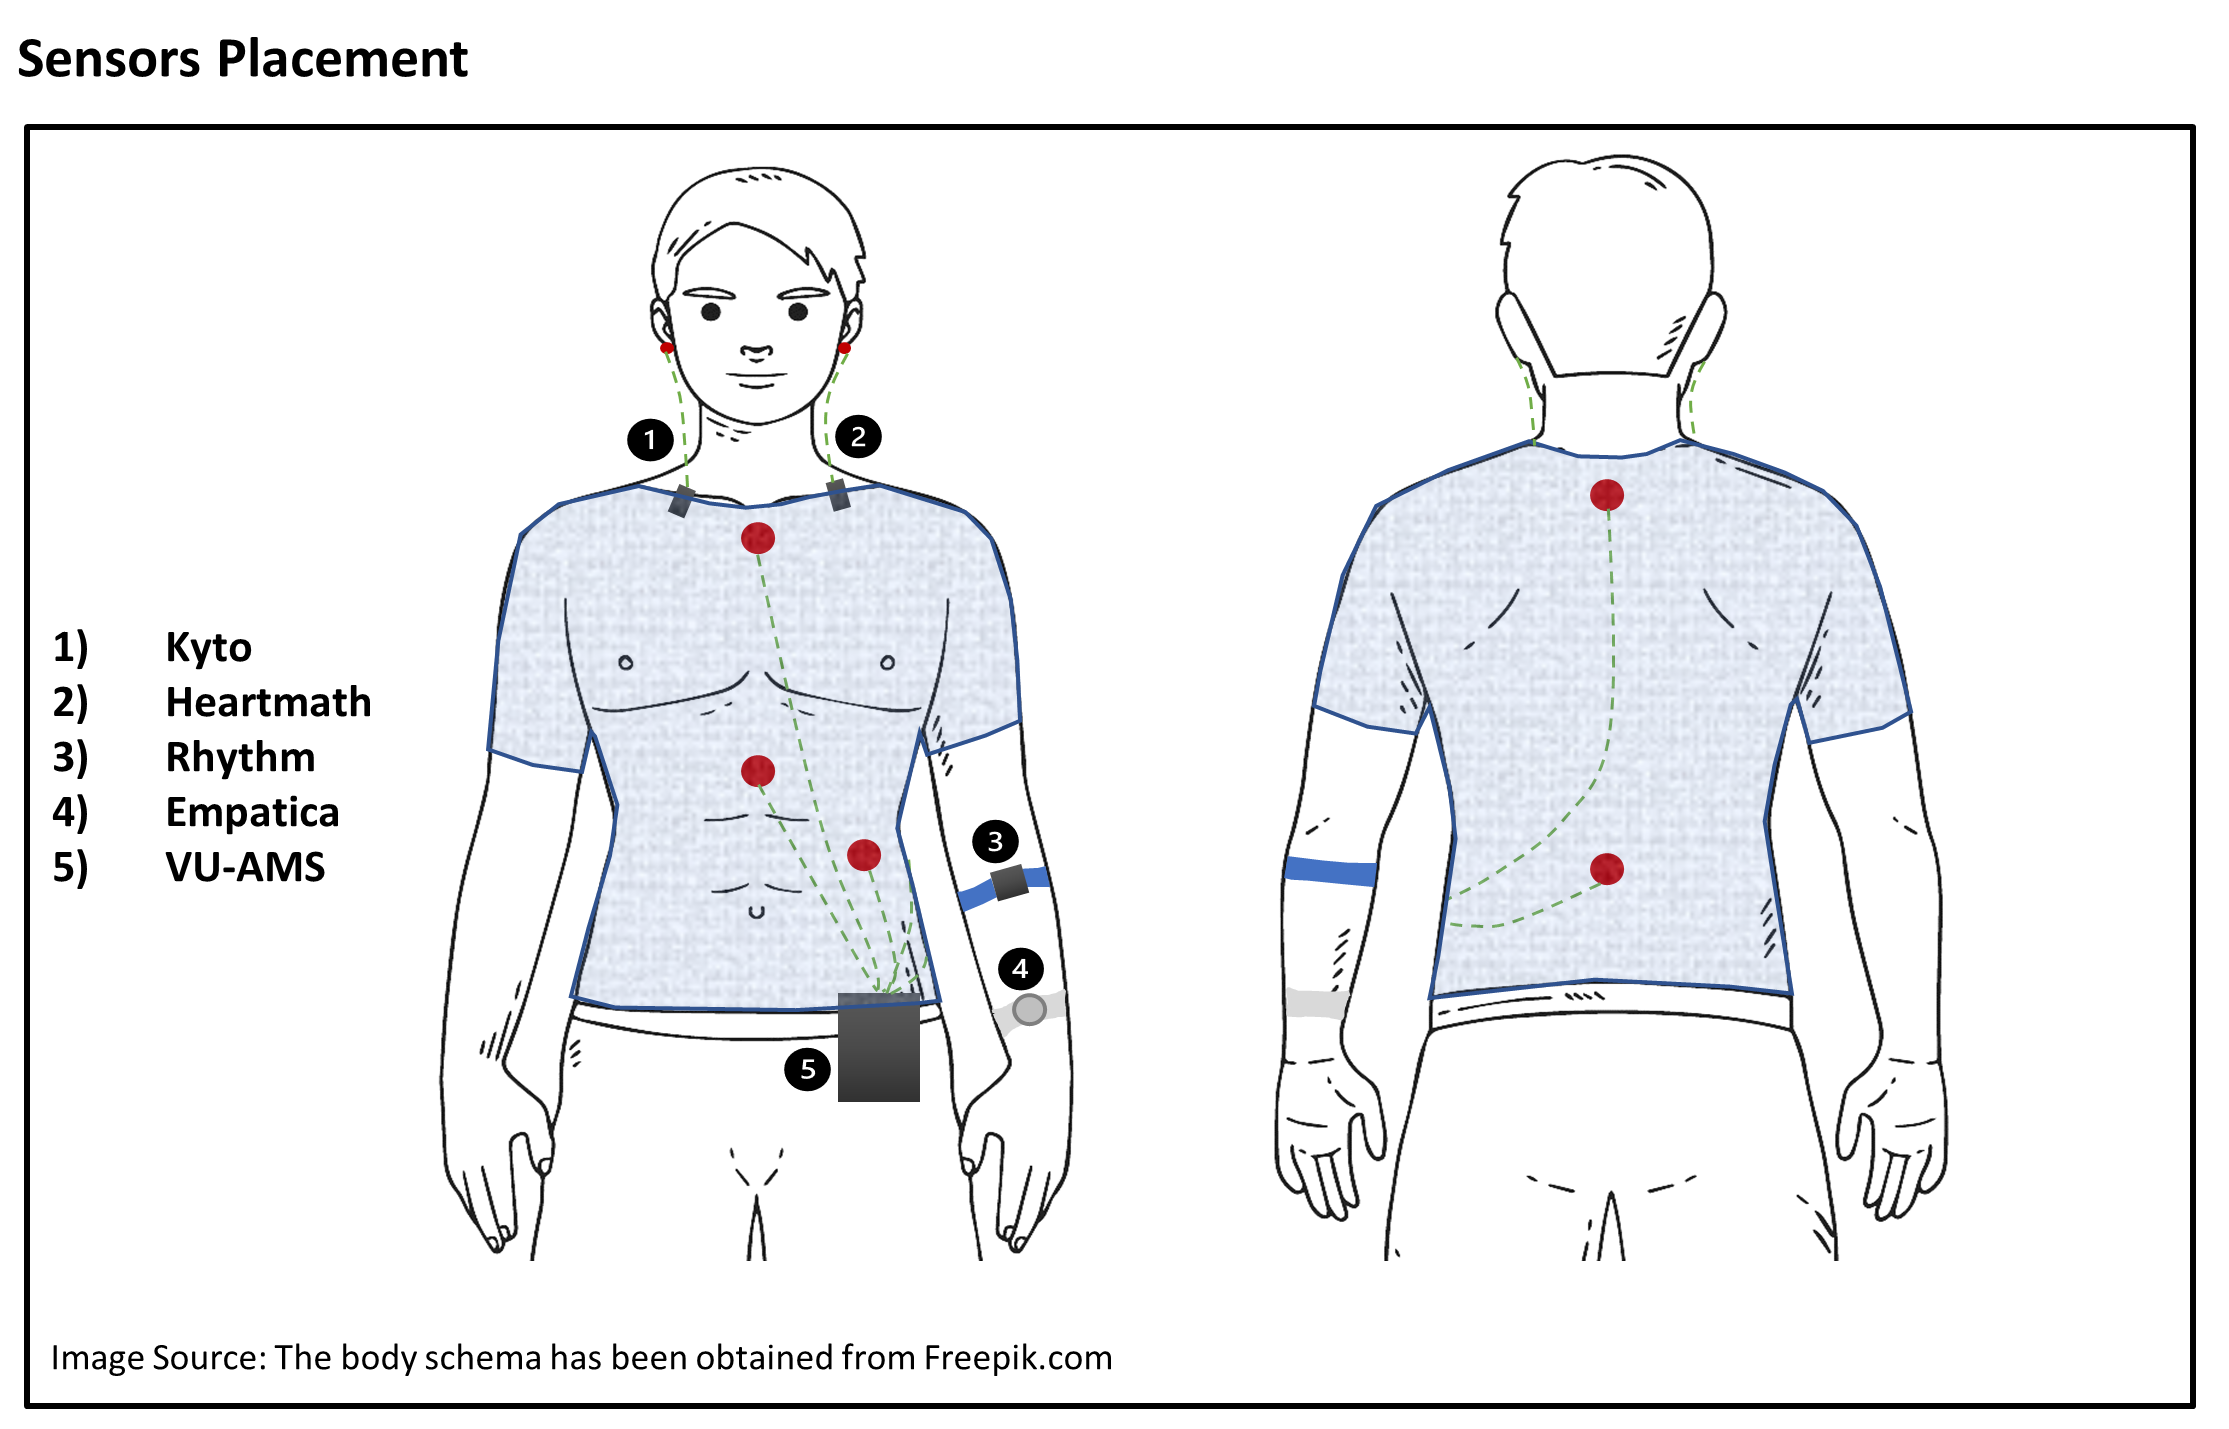
This is how your experiment may look like: a participant wearing a few wearables named Kyto, Heartmath, Empatica, Rhythm, together with a gold-standard ECG (VU-AMS), with electrodes on the chest, and will perform different tasks in different conditions (e.g., sitting for 5 minutes, standing up for 3 minutes, walking for 3 minutes, and biking for 3 minutes, while having all the devices on):
Individual Pipeline
Prepare Data
It is easy to read your data and experimental events with the pipeline from all your devices in one go.
# Importing Module
import wearablehrv

# downloading some example data
path = wearablehrv.data.download_data_and_get_path()
# Define the participant ID
pp = "test"
# Define your experimental conditions, for instance, sitting, standing, walking, and biking
conditions = ['sitting', 'standing', 'walking', 'biking']

# Define the devices you want to validate against the criterion.
devices = ["kyto", "heartmath", "rhythm", "empatica", "vu"]

# Redefine the name of the criterion device
criterion = "vu"

# Read data, experimental events, and segment the continuous data into smaller chunks
data = wearablehrv.individual.import_data (path, pp, devices)
events = wearablehrv.individual.define_events (path, pp, conditions, already_saved= True, save_as_csv= False)
data_chopped = wearablehrv.individual.chop_data (data, conditions, events, devices)
Preprocess Data
You have various methods to properly preprocess your raw data.
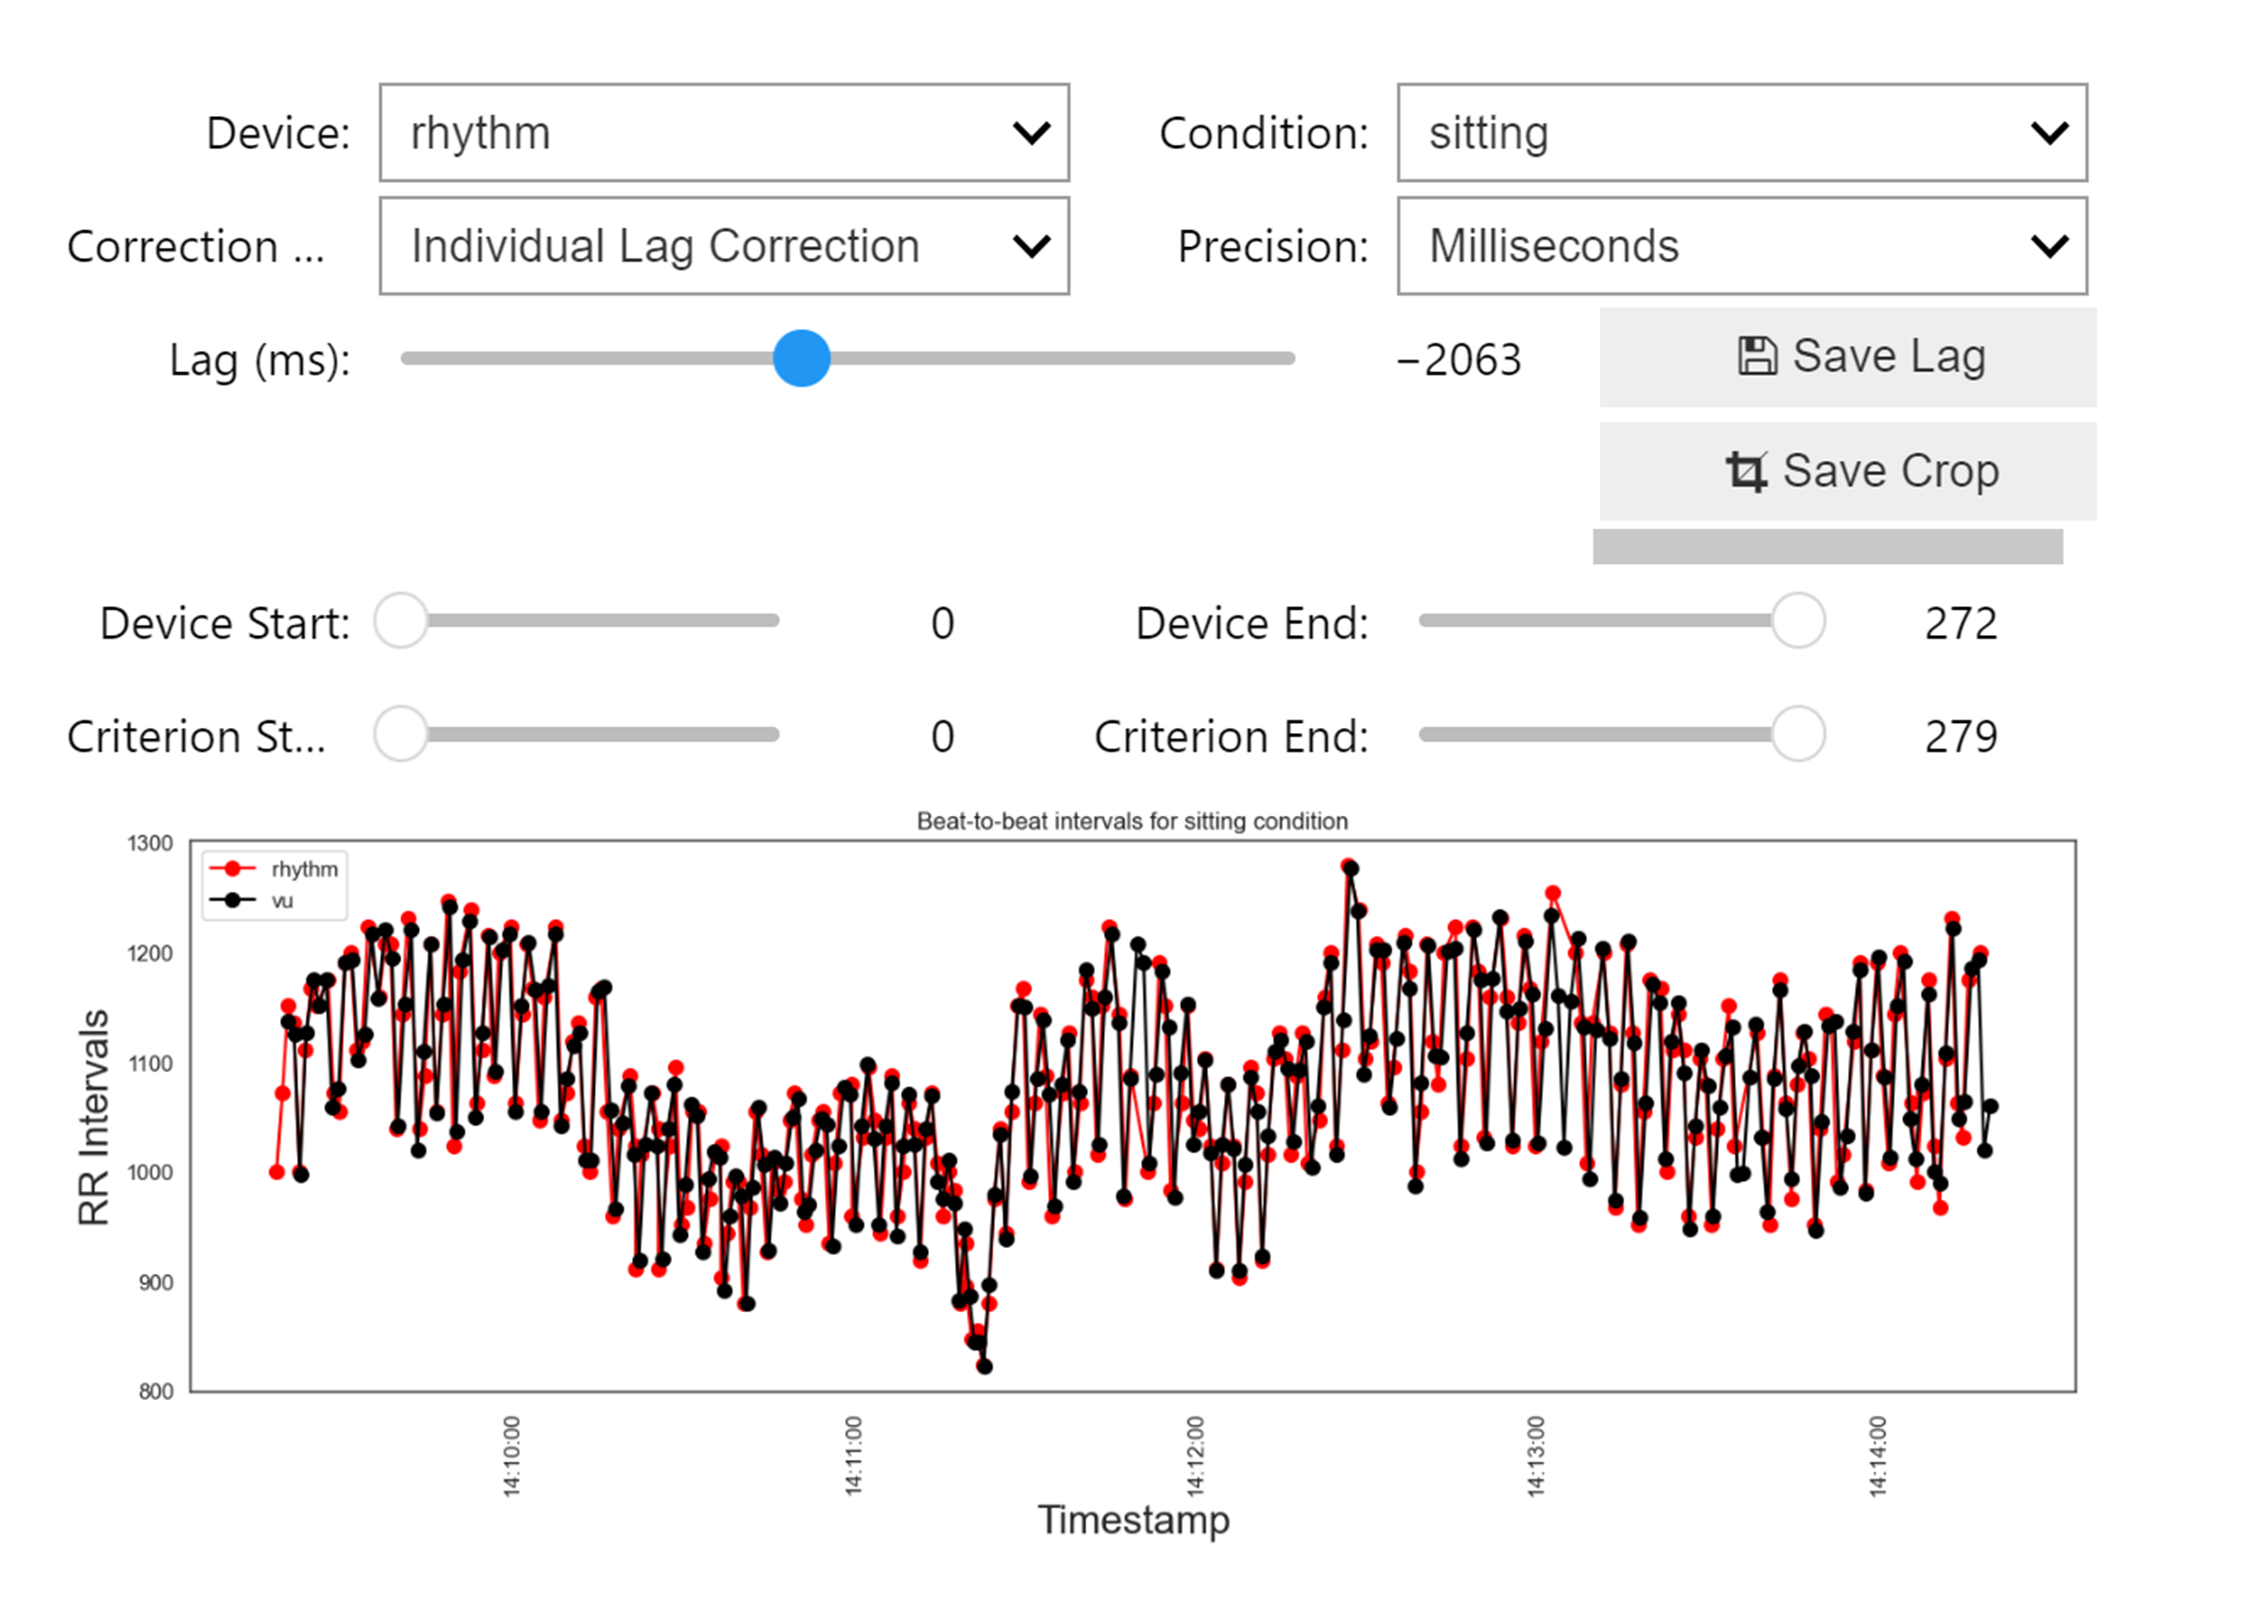
Correct the Lag, Trim Data
With a user-friendly GUI, correct the lag between devices, align data by cropping the beginning and the end of each of your devices, and have full control over each device and condition.
wearablehrv.individual.visual_inspection (data_chopped, devices, conditions,criterion)
Detect Outliers and Ectopic Beats
Easily perform different types of detection methods for each device and in each condition. This is an important advantage that allows you to easily run this within a condition, for a specific device, to make the preprocessing independent.
data_pp, data_chopped = wearablehrv.individual.pre_processing (data_chopped, devices, conditions, method="karlsson", custom_removing_rule = 0.25, low_rri=300, high_rri=2000)
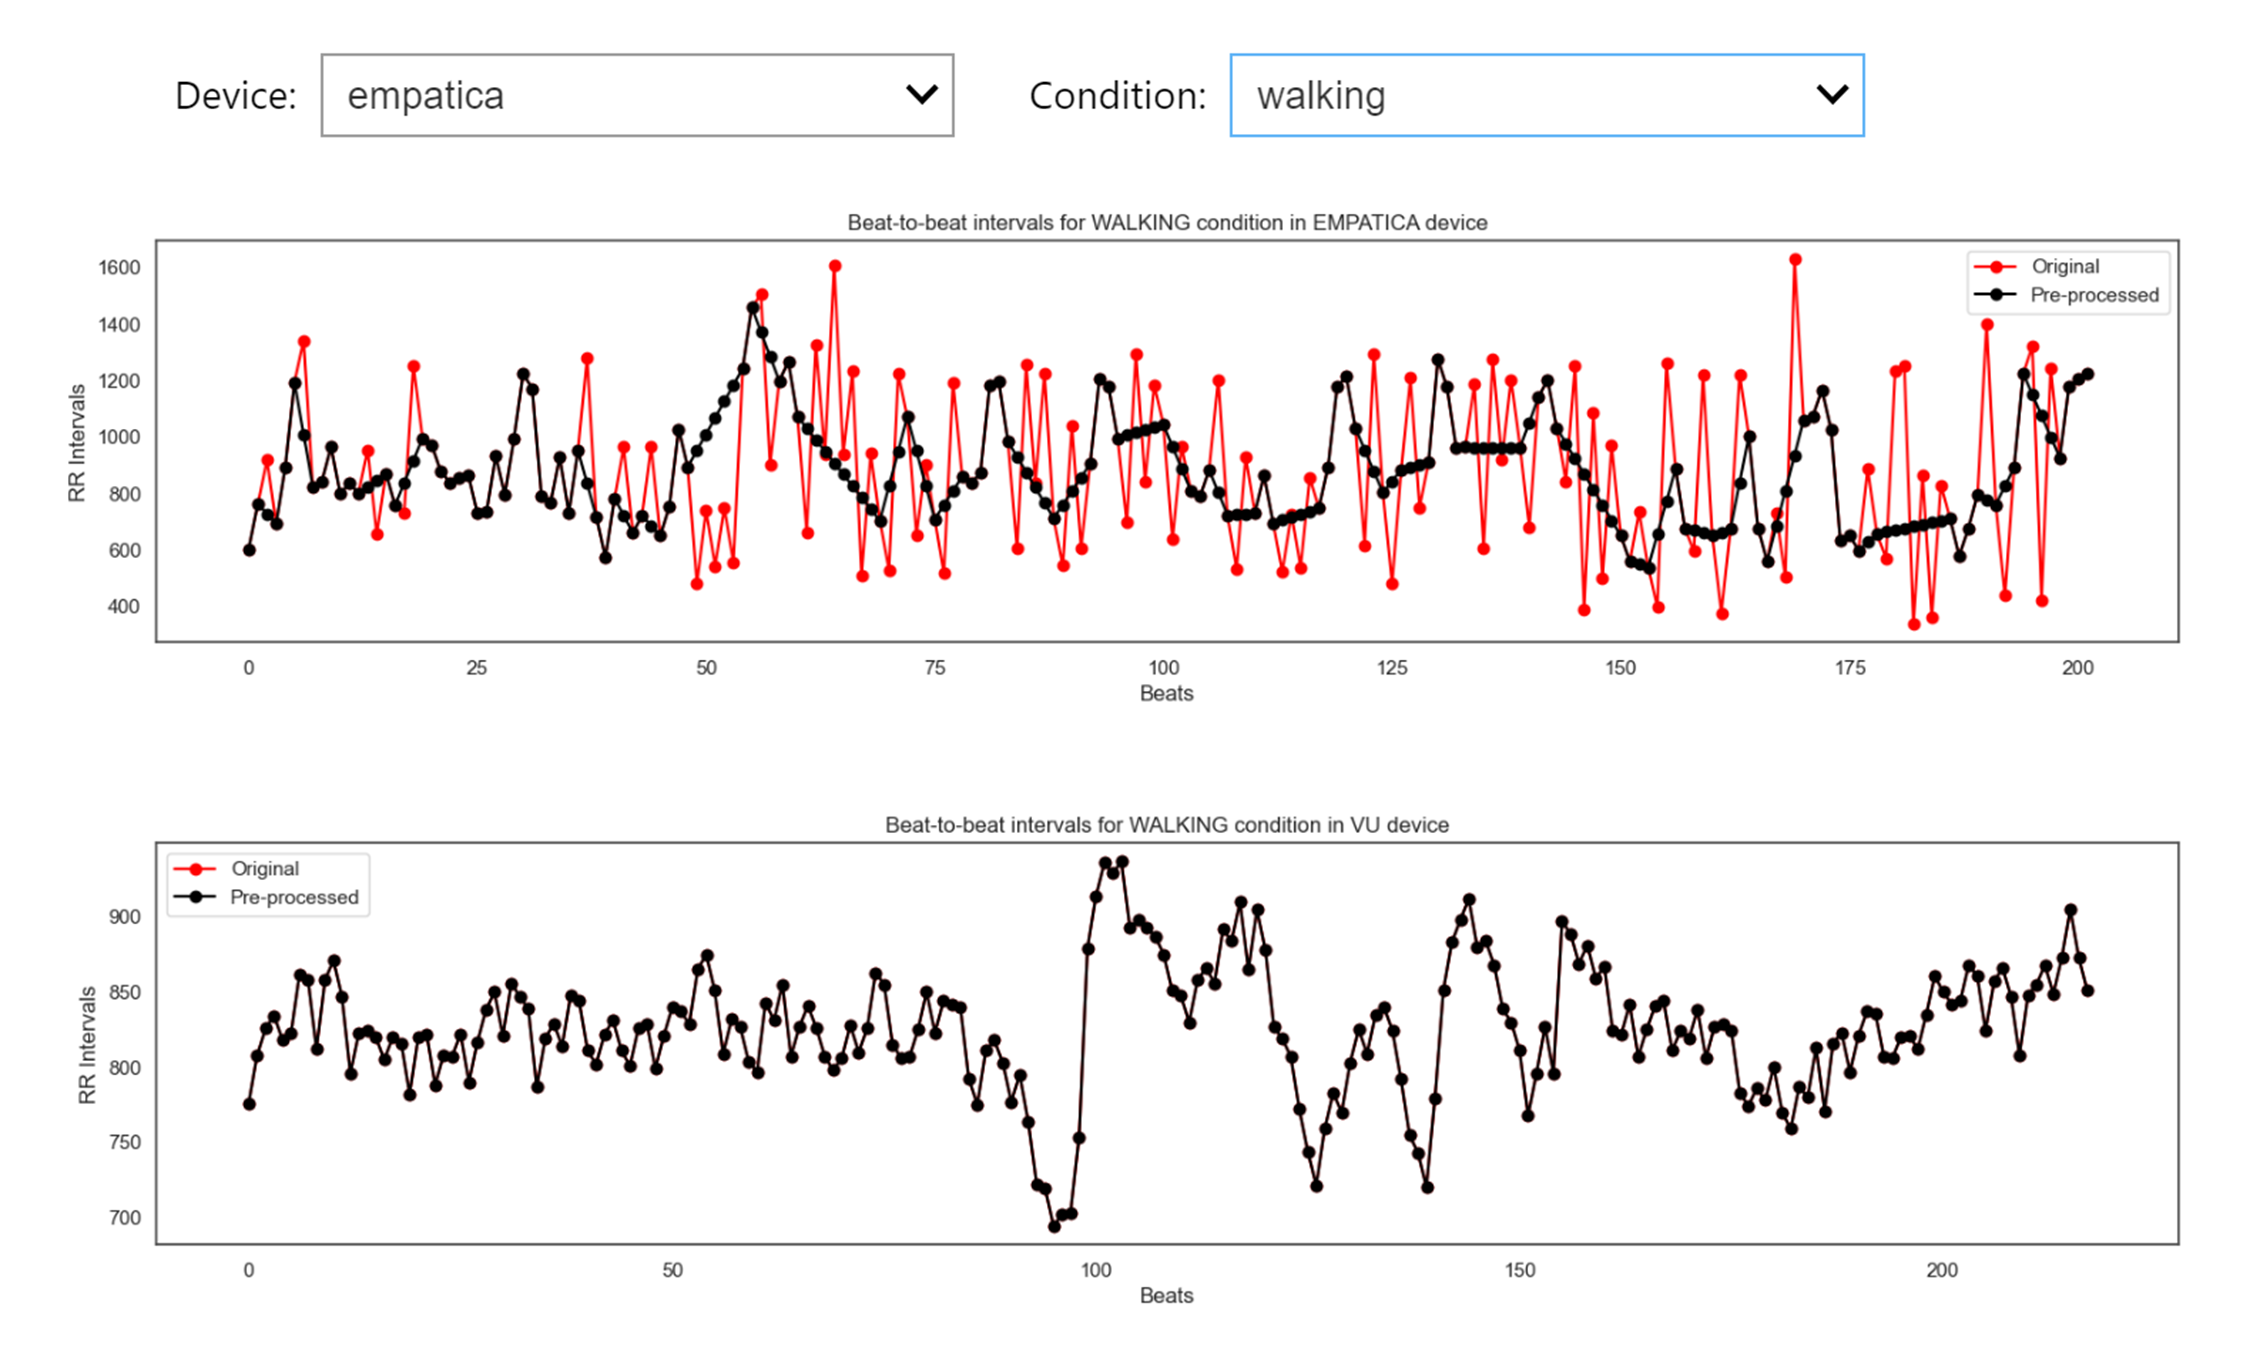
Diagnostic Plots
Check how well you performed the preprocessing by comparing the detected outliers in the criterion and your selected device.
wearablehrv.individual.ibi_comparison_plot(data_chopped, data_pp, devices, conditions, criterion, width=20, height=10)
Analyze and Plot
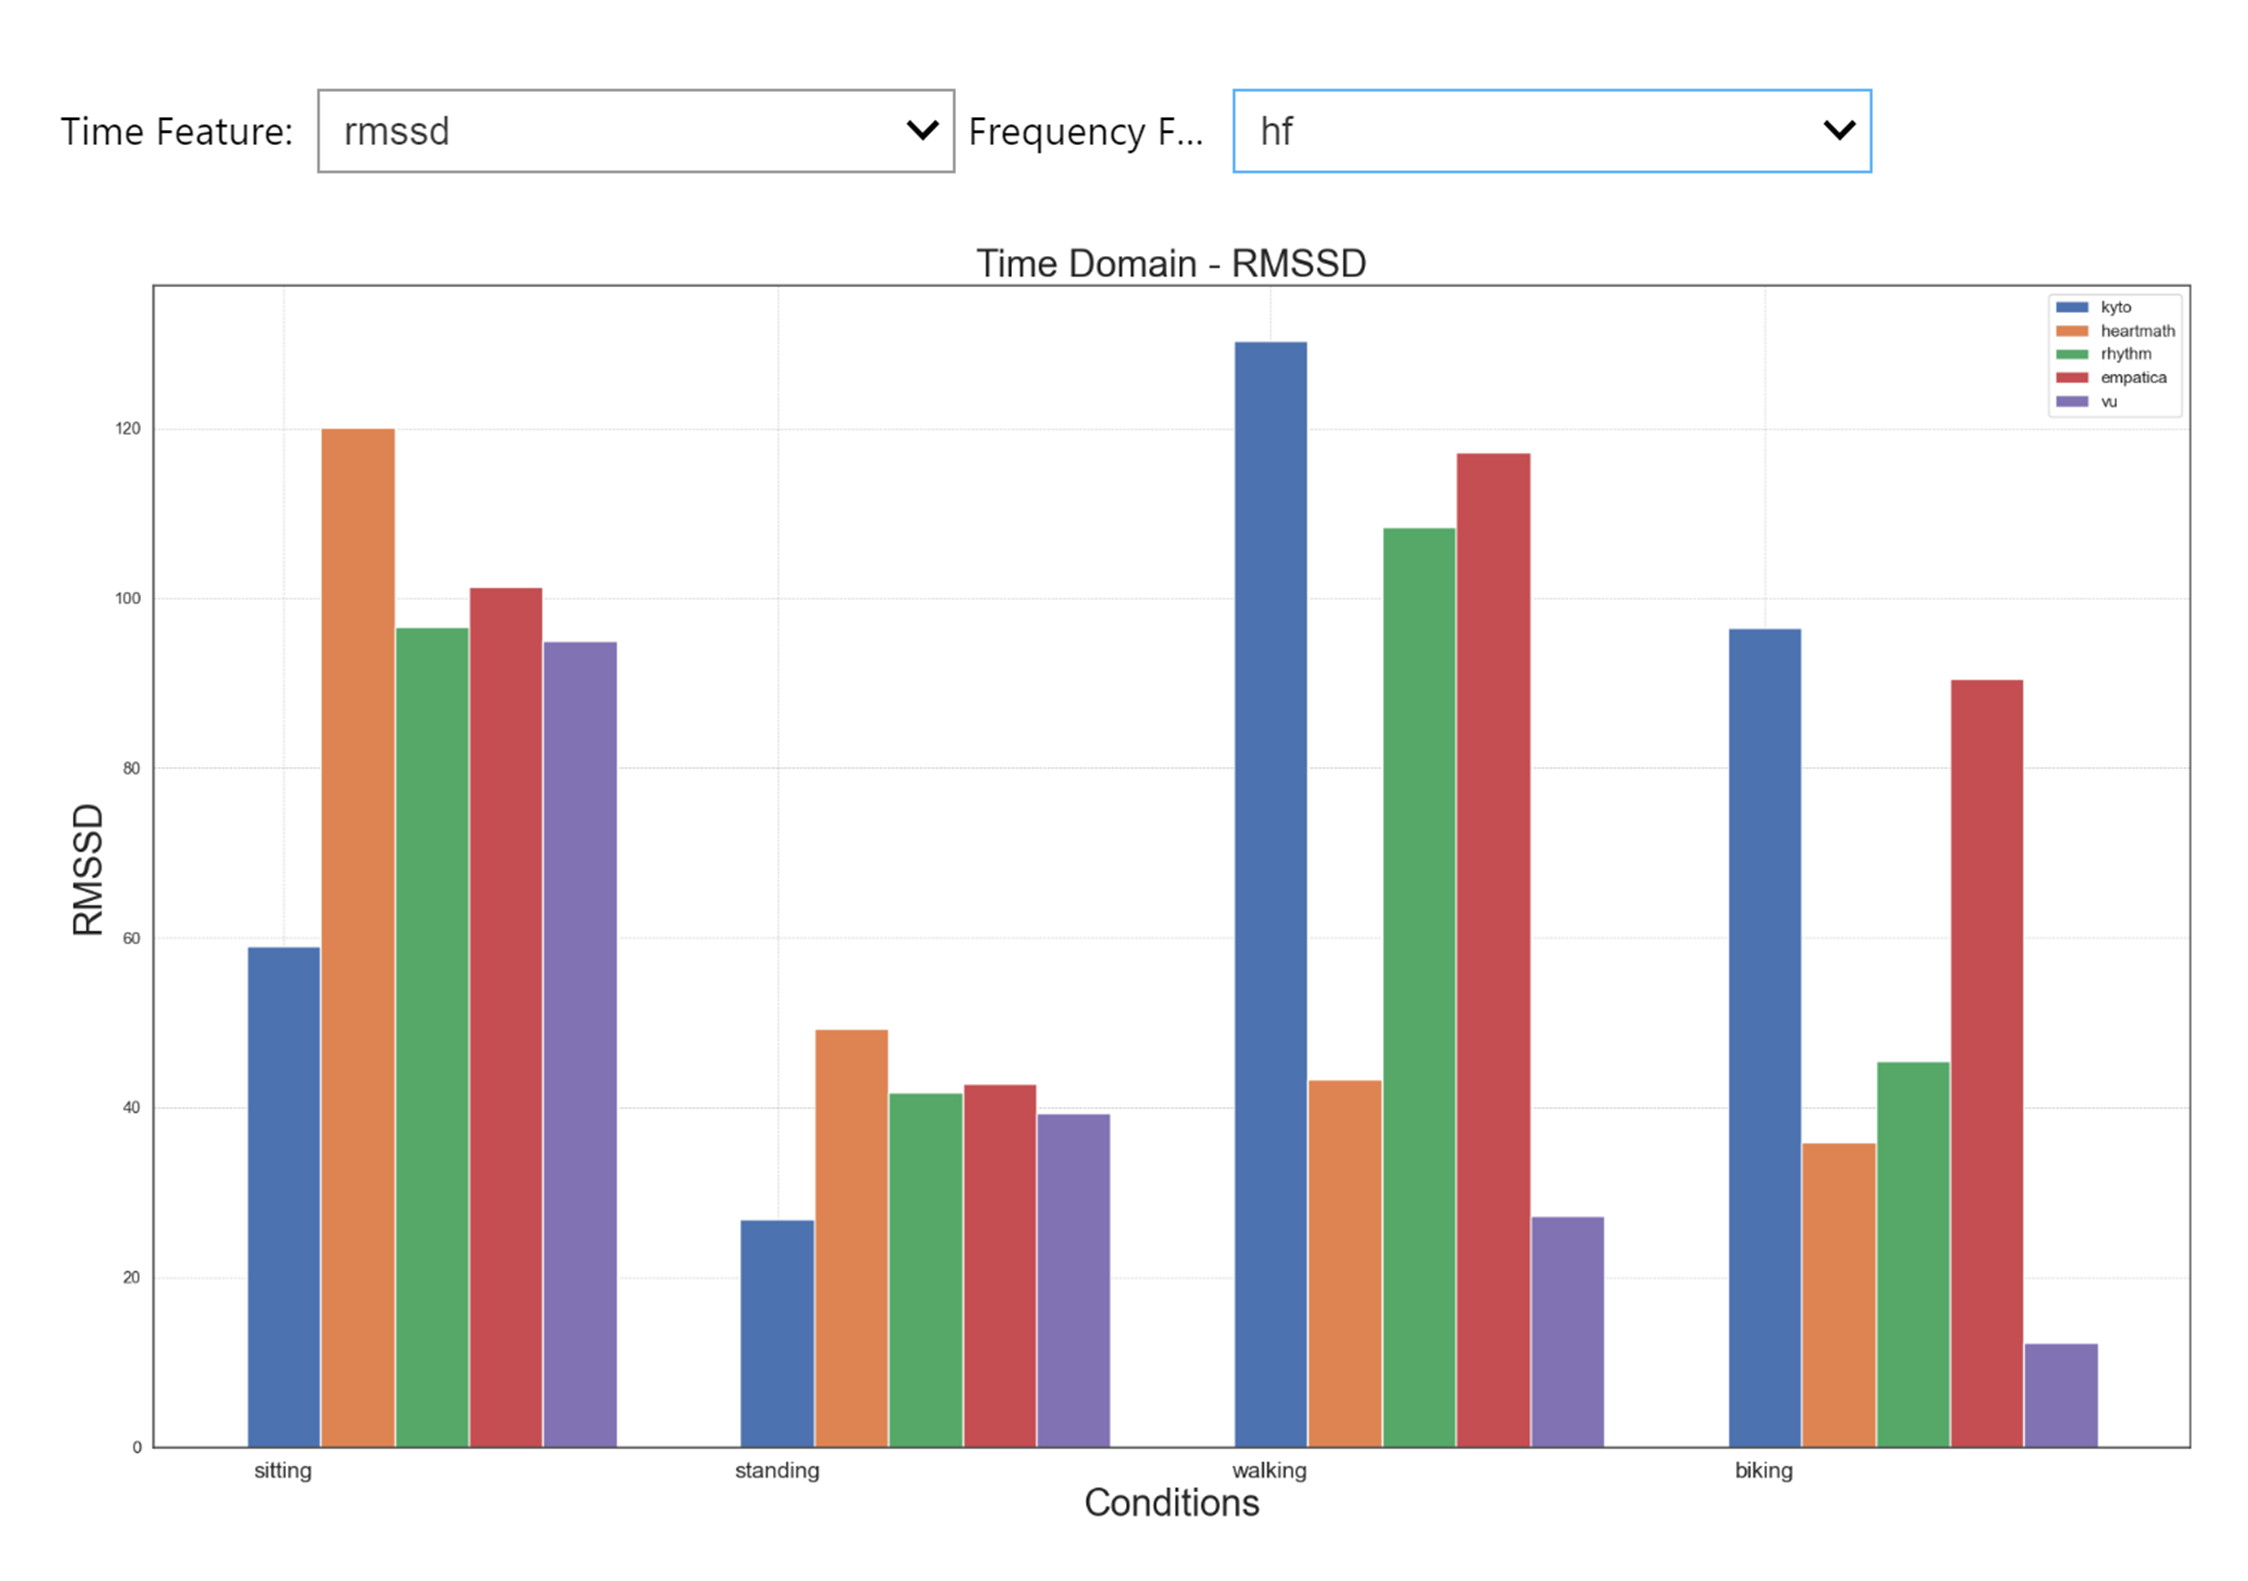
Easily calculate all relevant outcome variables (e.g., RMSSD, mean HR, frequency domain measures) in all your devices and conditions, and use various plotting options.
time_domain_features, frequency_domain_features = wearablehrv.individual.data_analysis(data_pp, devices, conditions)
wearablehrv.individual.bar_plot(time_domain_features, frequency_domain_features, devices, conditions, width=20, height=25, bar_width = 0.15)
Group Pipeline
Prepare Data
Easily load all processed data that you have put through the Individual Pipeline.
wearablehrv.data.clear_wearablehrv_cache()
path = wearablehrv.data.download_data_and_get_path(["P01.csv", "P02.csv", "P03.csv", "P04.csv", "P05.csv", "P06.csv", "P07.csv", "P08.csv", "P09.csv", "P10.csv"])
conditions = ['sitting', 'standing', 'walking', 'biking']
devices = ["kyto", "heartmath", "rhythm", "empatica", "vu"]
criterion = "vu"
features = ["rmssd", 'mean_hr', 'nibi_after_cropping', 'artefact']
data, file_names = wearablehrv.group.import_data(path, conditions, devices, features) # Select the features you are interested in
data = wearablehrv.group.nan_handling(data, devices, features, conditions)
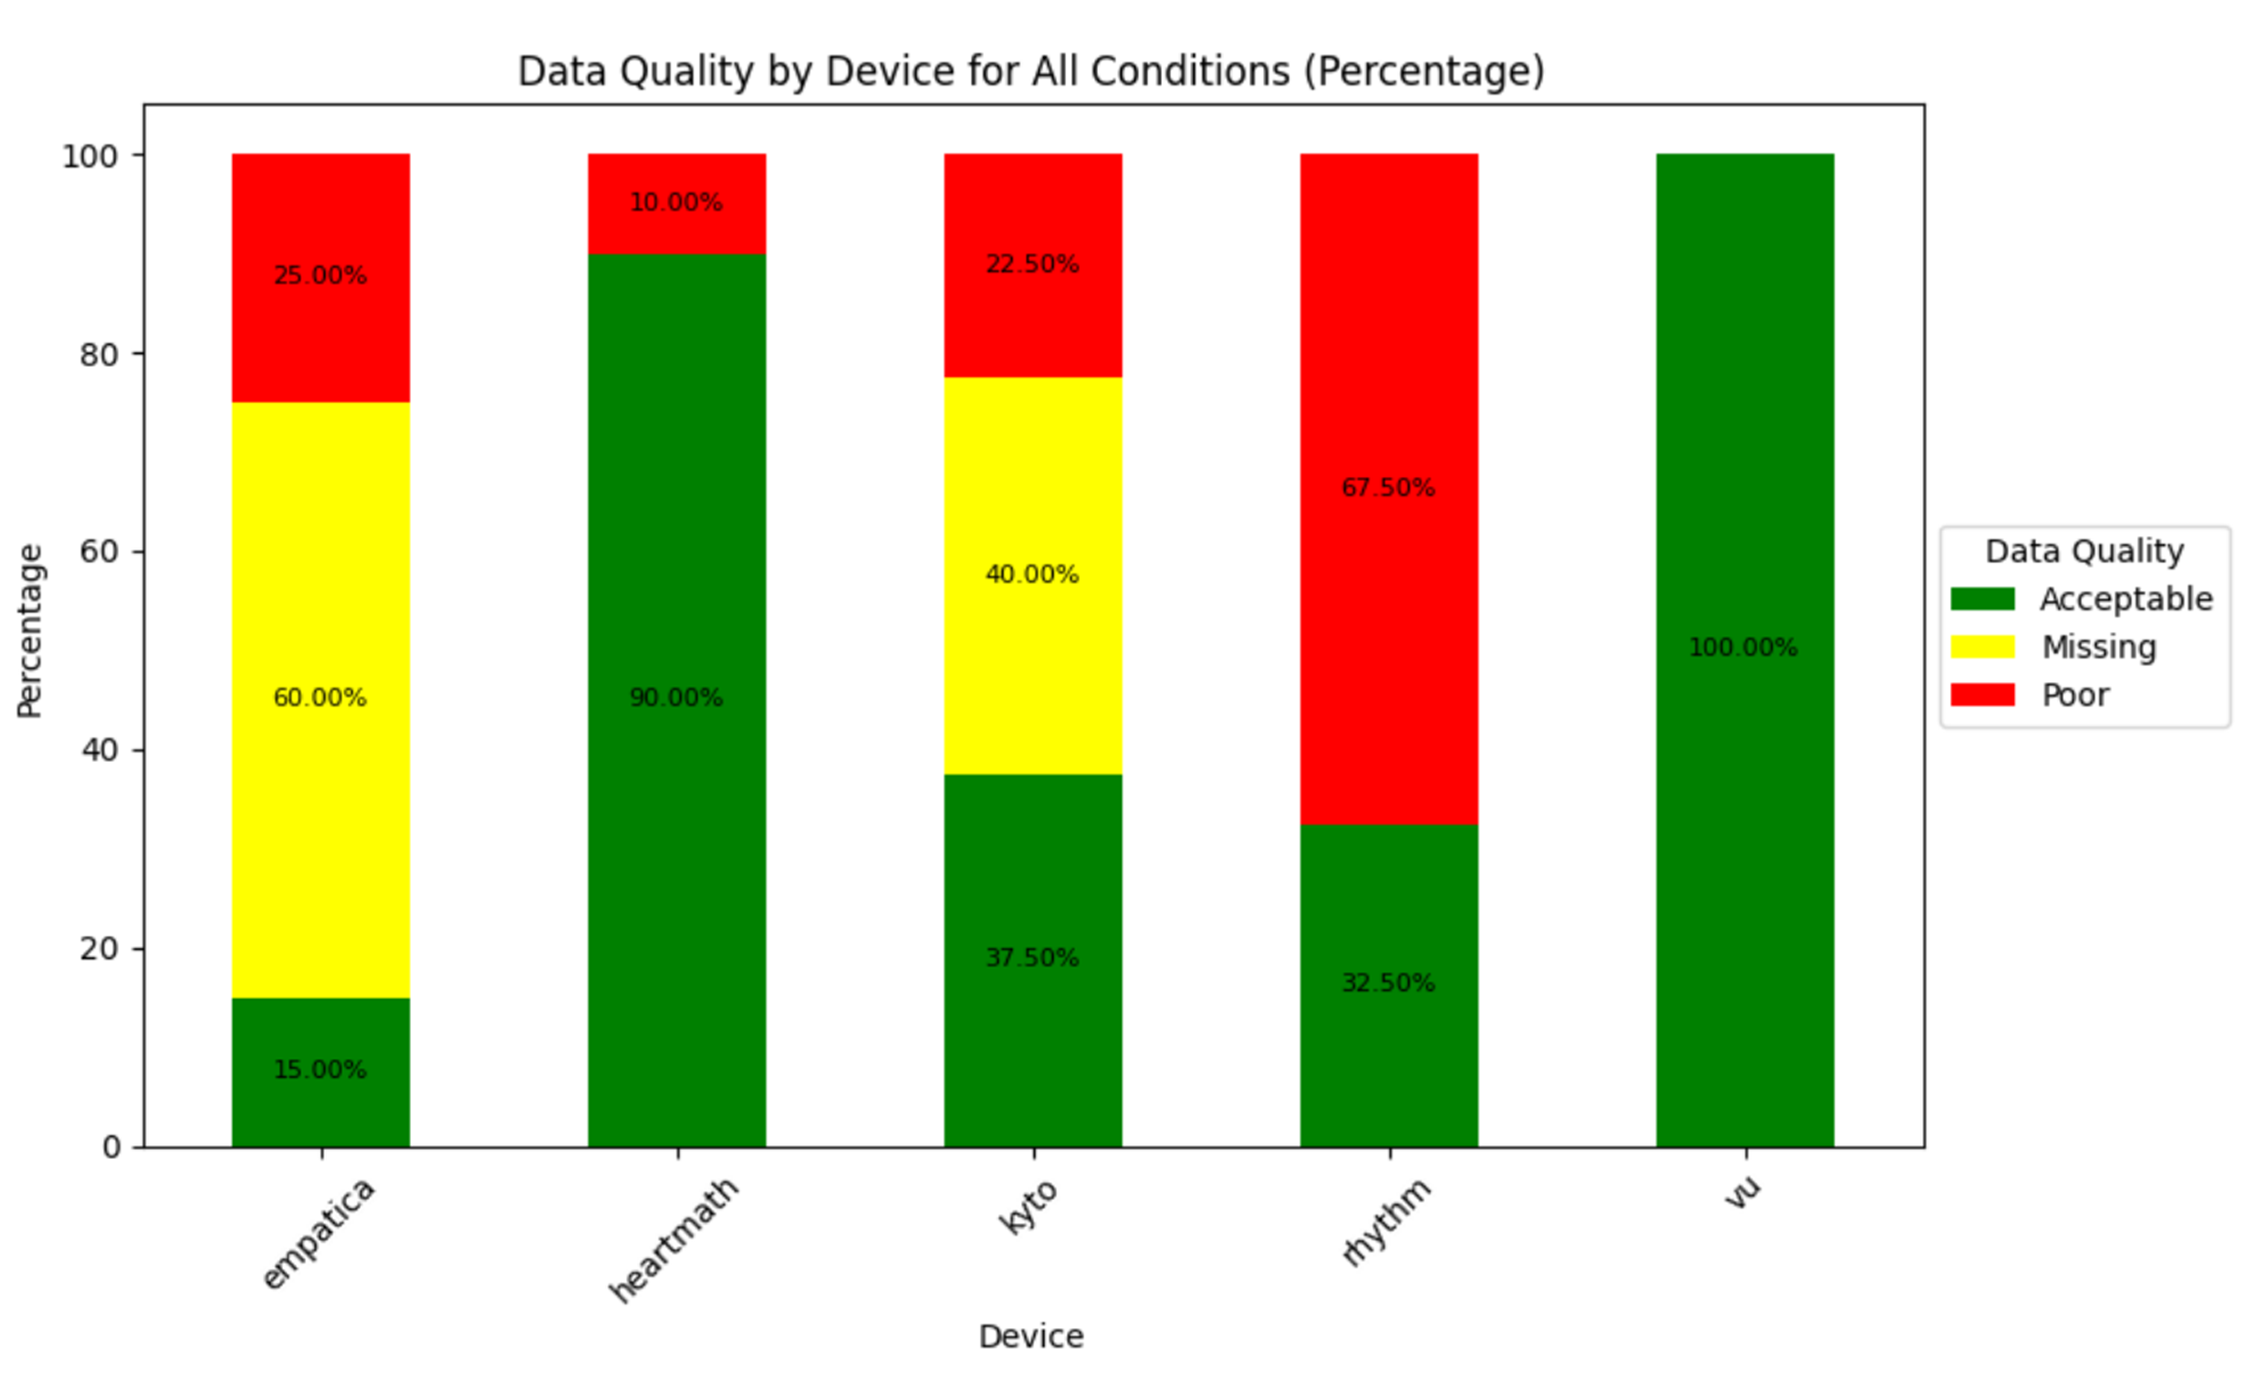
Signal Quality
A powerful tool to assess and report signal quality in all your wearables, in all conditions. You just need to define a few thresholds.
data, features, summary_df, quality_df = wearablehrv.group.signal_quality(data, path, conditions, devices, features, criterion, file_names, ibi_threshold = 0.30, artefact_threshold = 0.30)
wearablehrv.group.signal_quality_plot2(summary_df, condition_selection=False, condition=None)
Statistical Analysis
Perform four of the most common statistical methods for validation, and create plots, again, for all your devices, in all conditions, just by running a few functions.
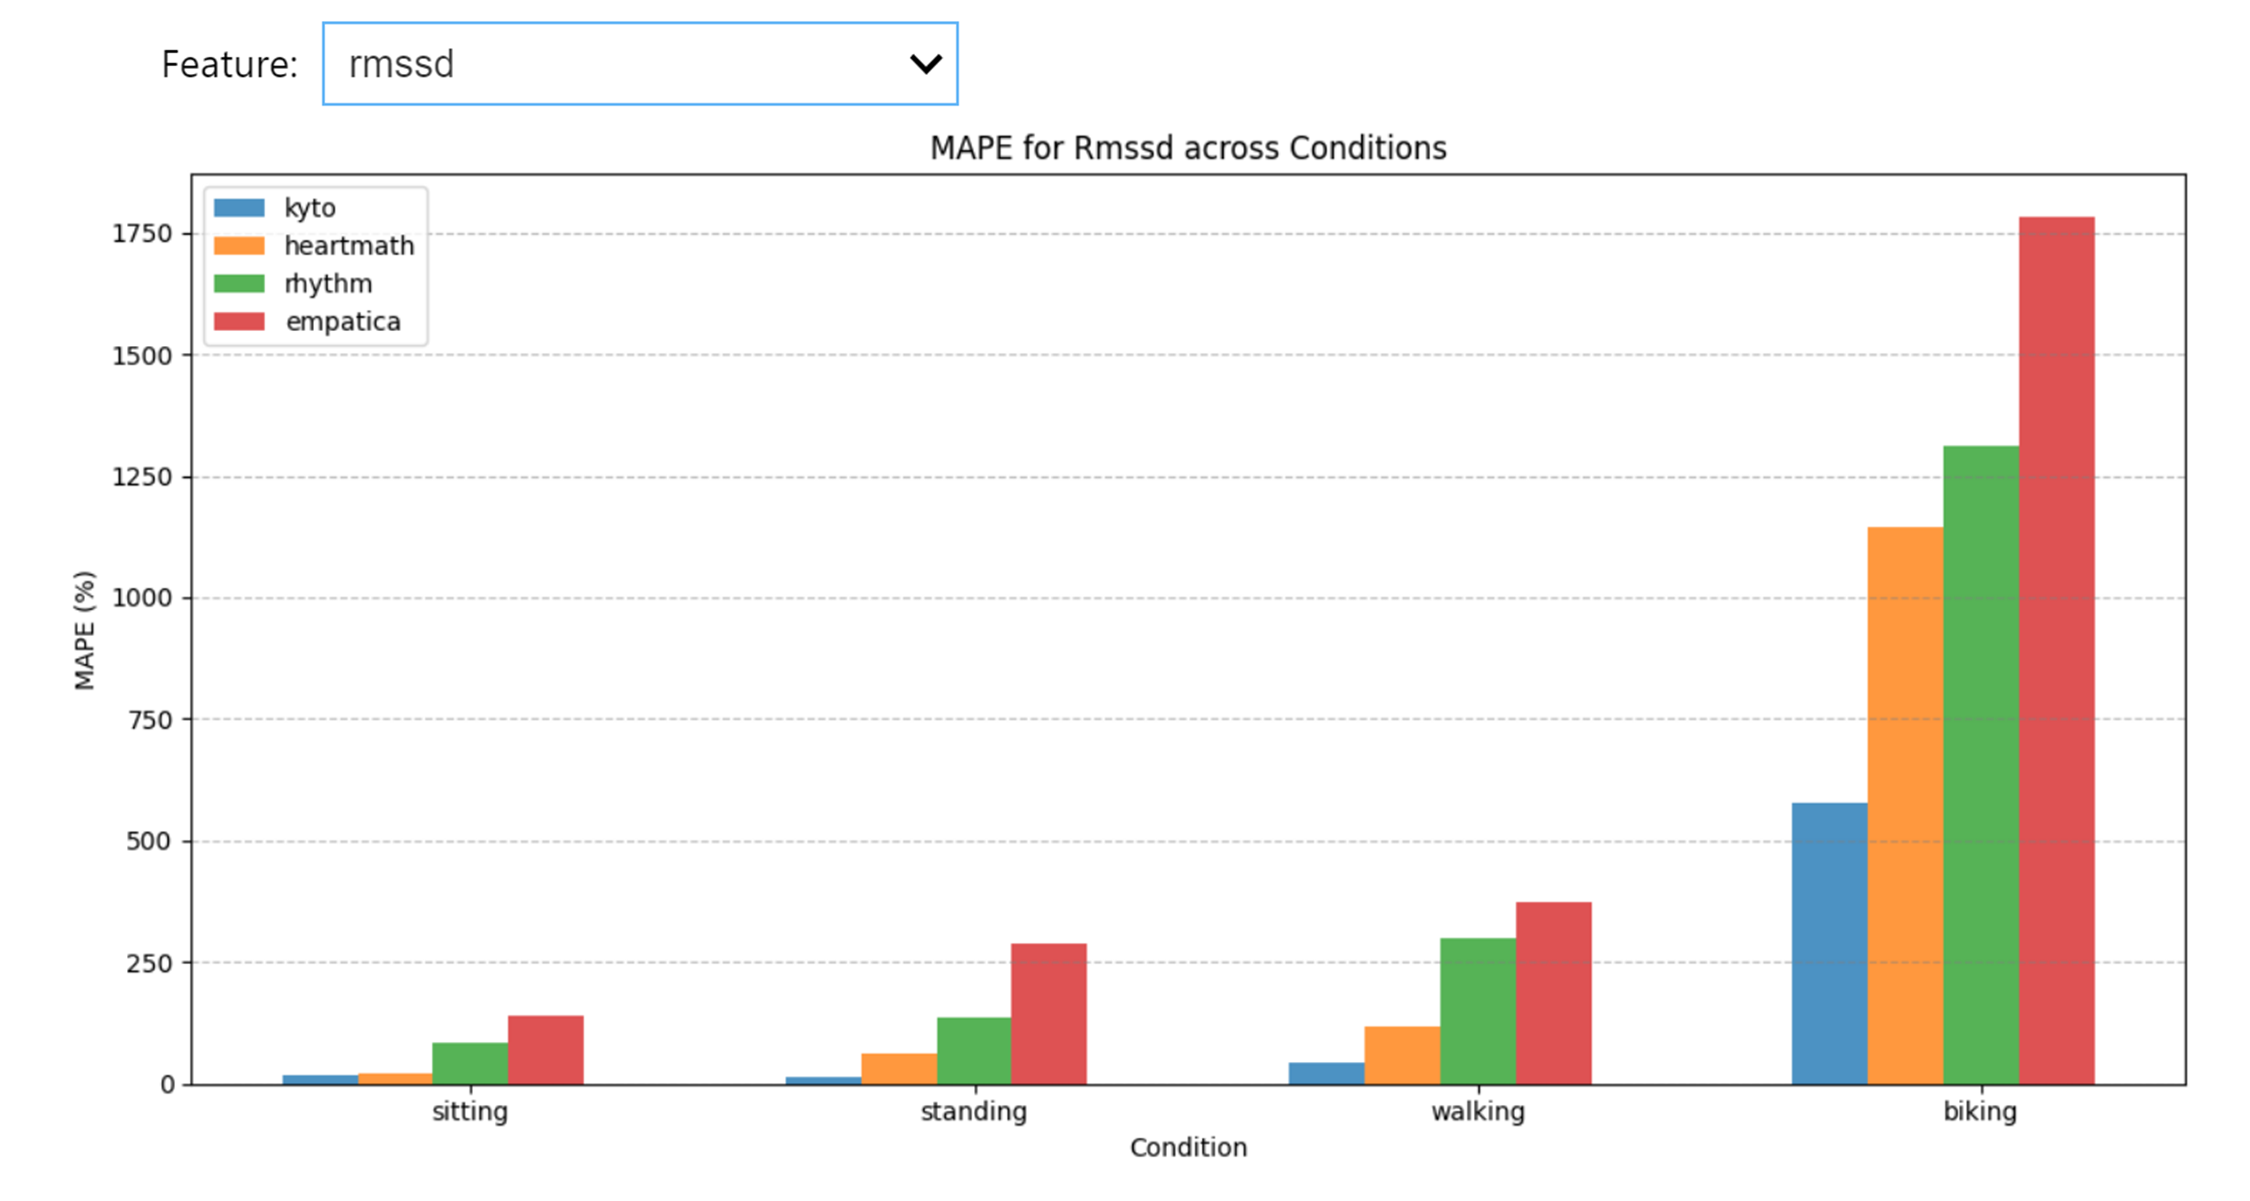
Mean Absolute Percentage Error
mape_data = wearablehrv.group.mape_analysis(data, criterion, devices, conditions, features)
wearablehrv.group.mape_plot(mape_data, features, conditions, devices)
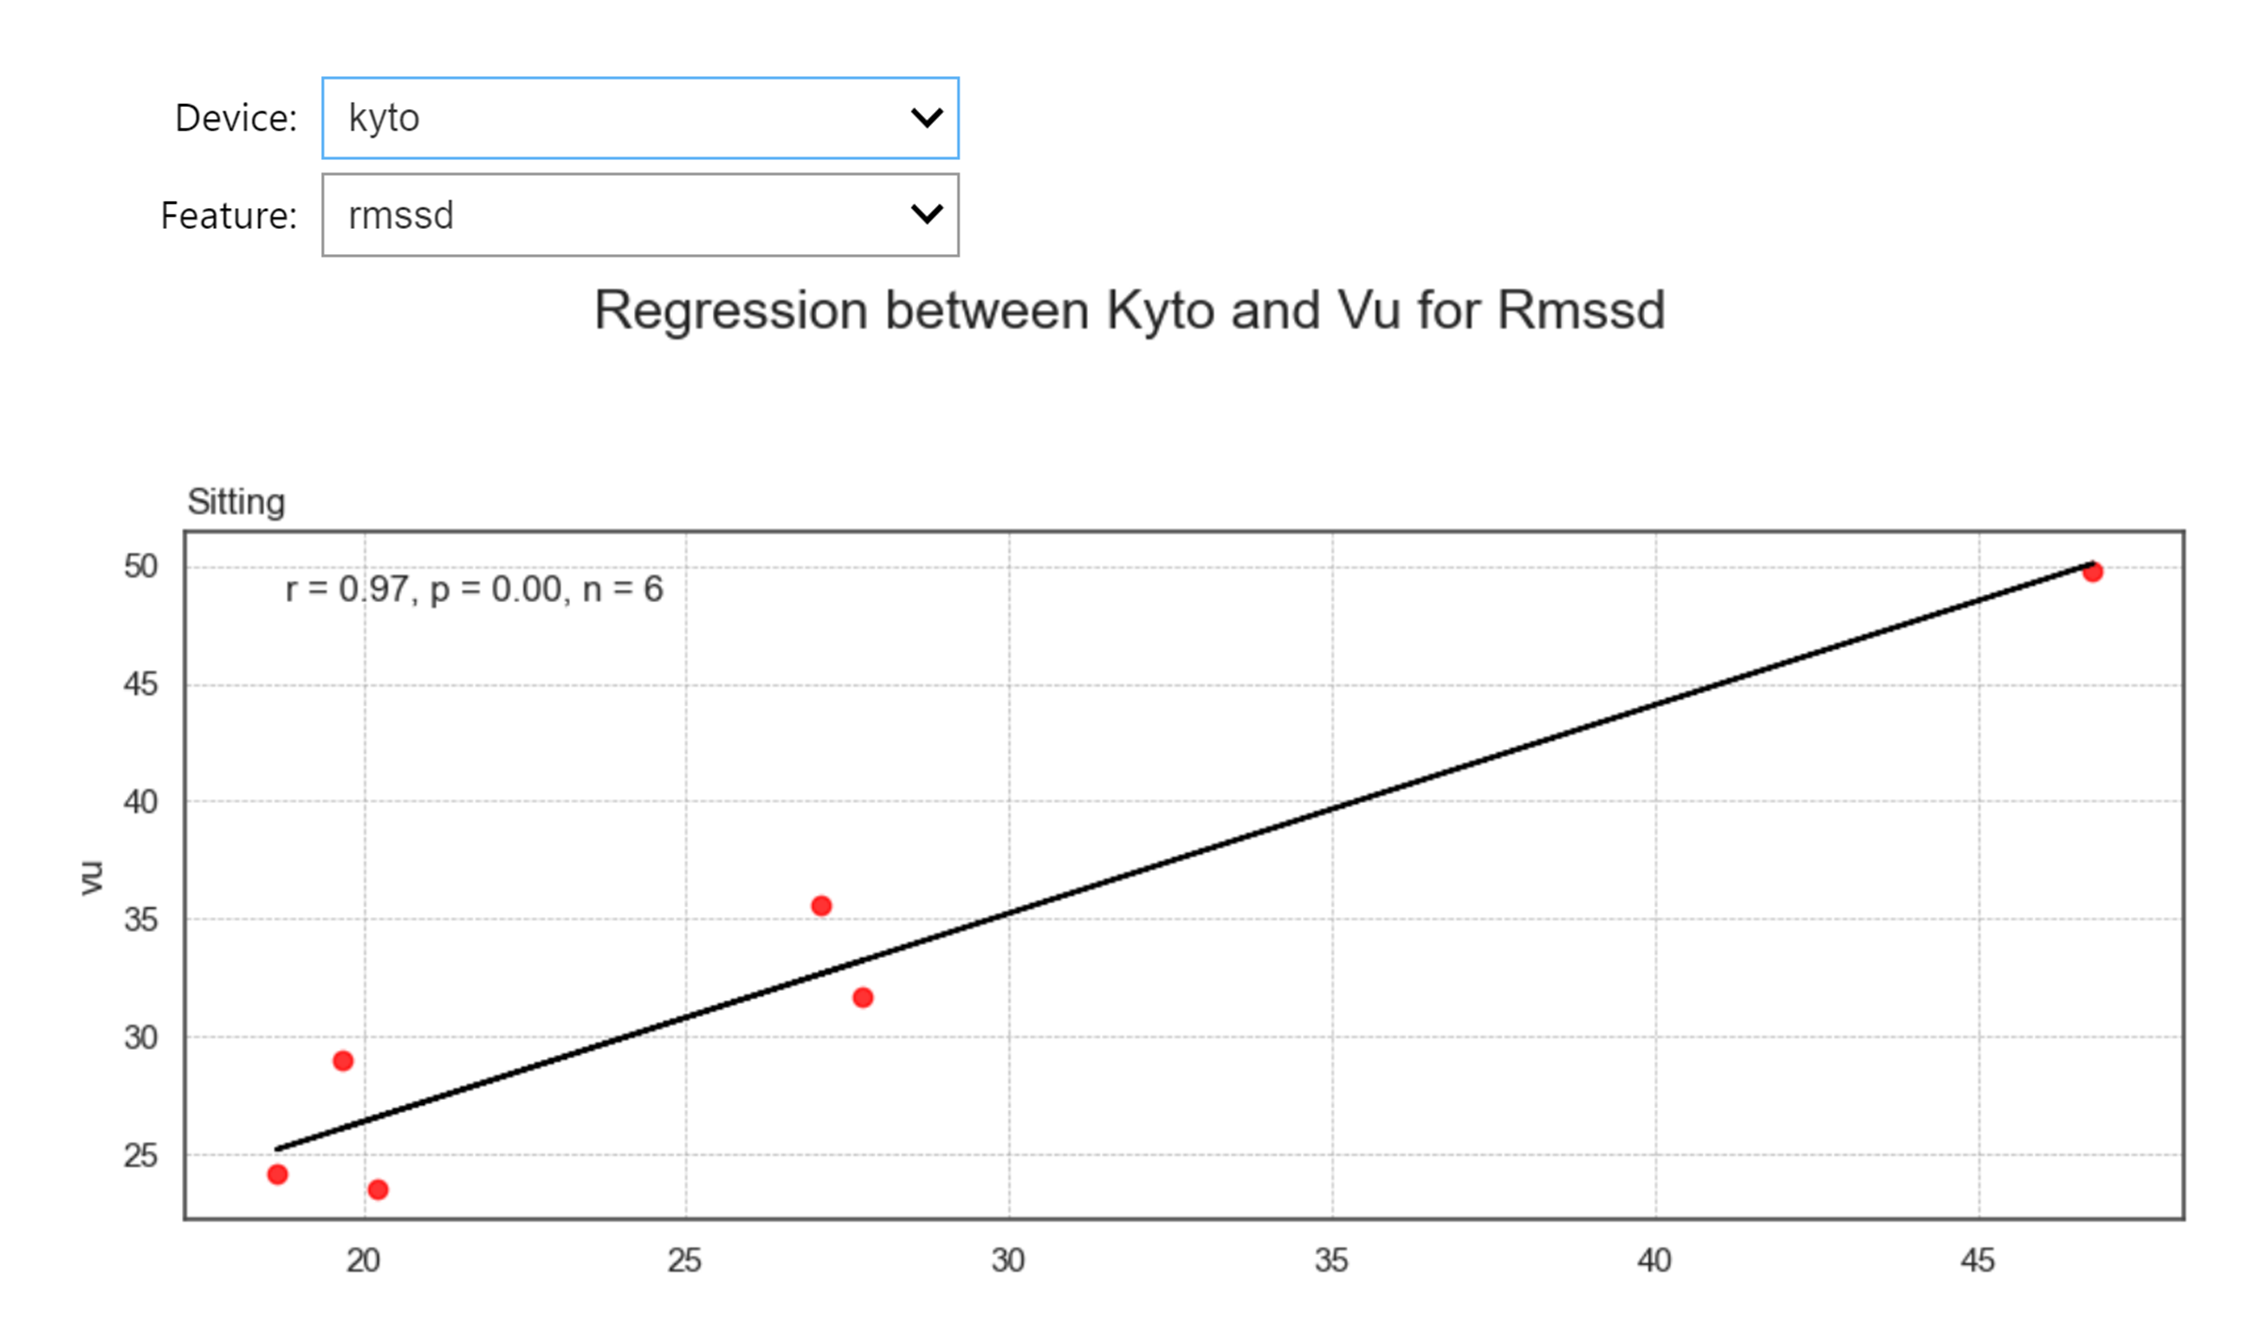
Regression Analysis
regression_data = wearablehrv.group.regression_analysis(data, criterion, conditions, devices, features, path)
wearablehrv.group.regression_plot(regression_data, data, criterion, conditions, devices, features, marker_color='red', width=10, height_per_condition=4)
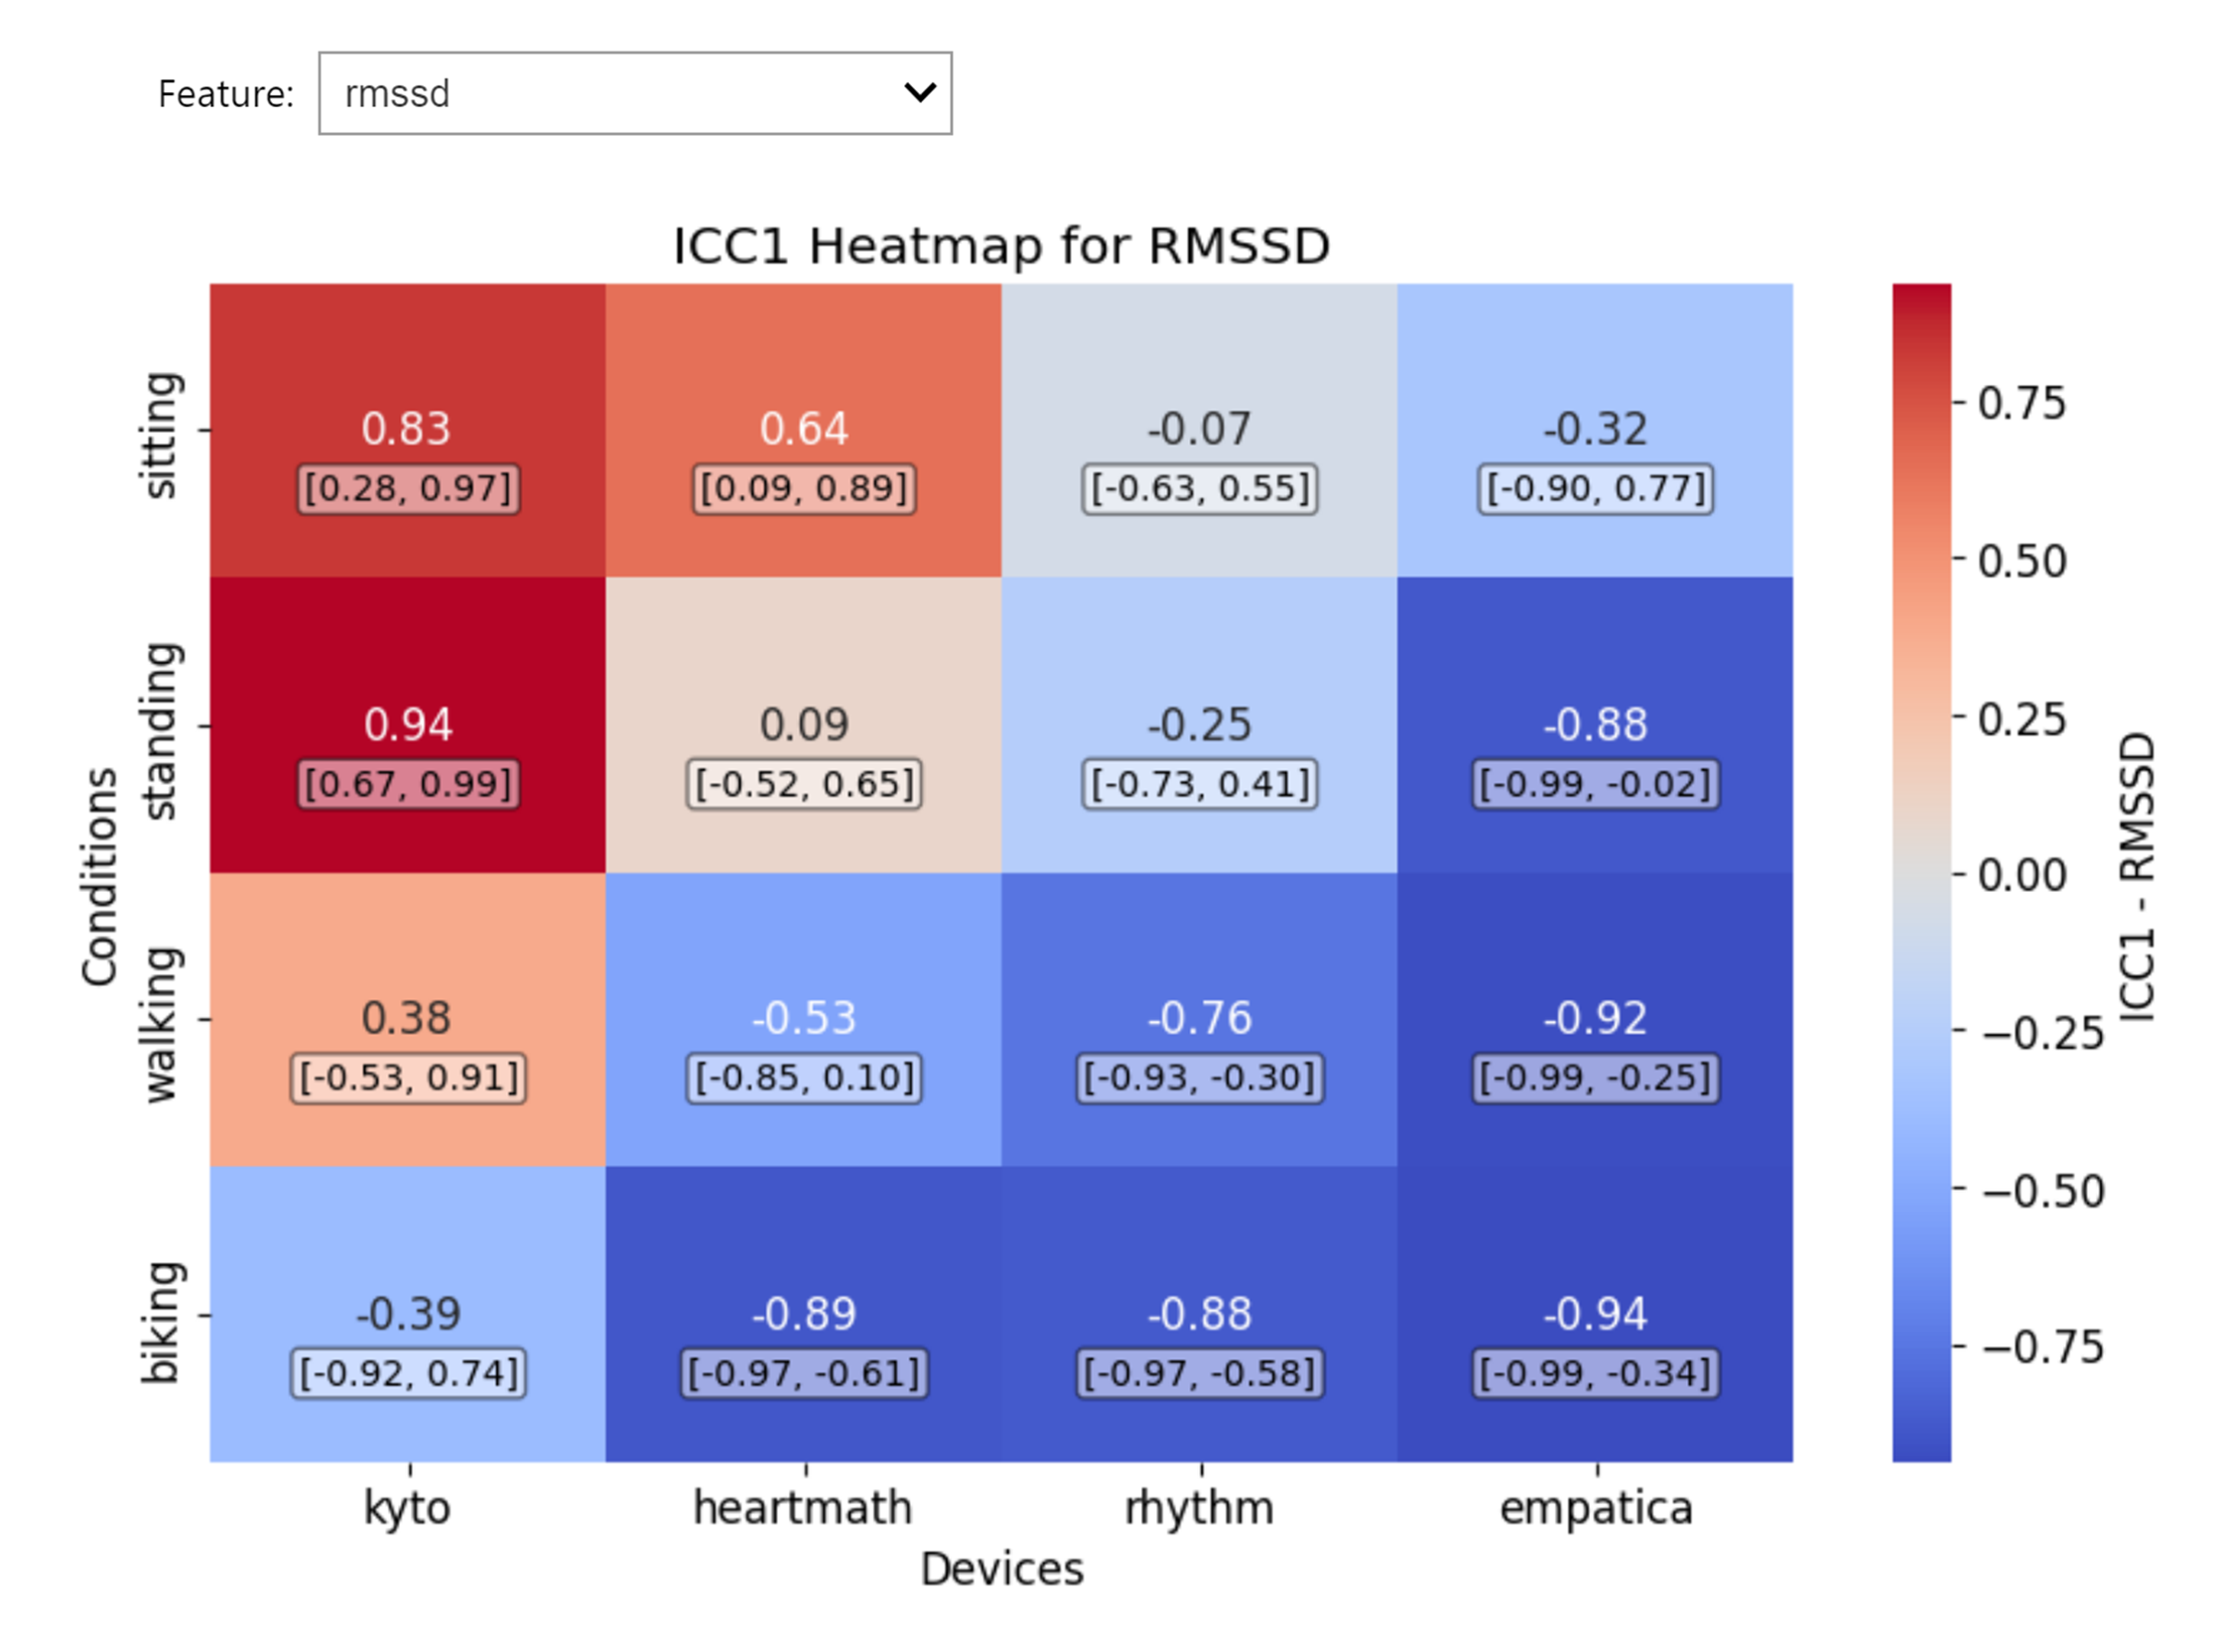
Intraclass Correlation Coefficient
icc_data = wearablehrv.group.icc_analysis(data, criterion, devices, conditions, features, path, save_as_csv=False)
wearablehrv.group.icc_plot(icc_data, conditions, devices, features)
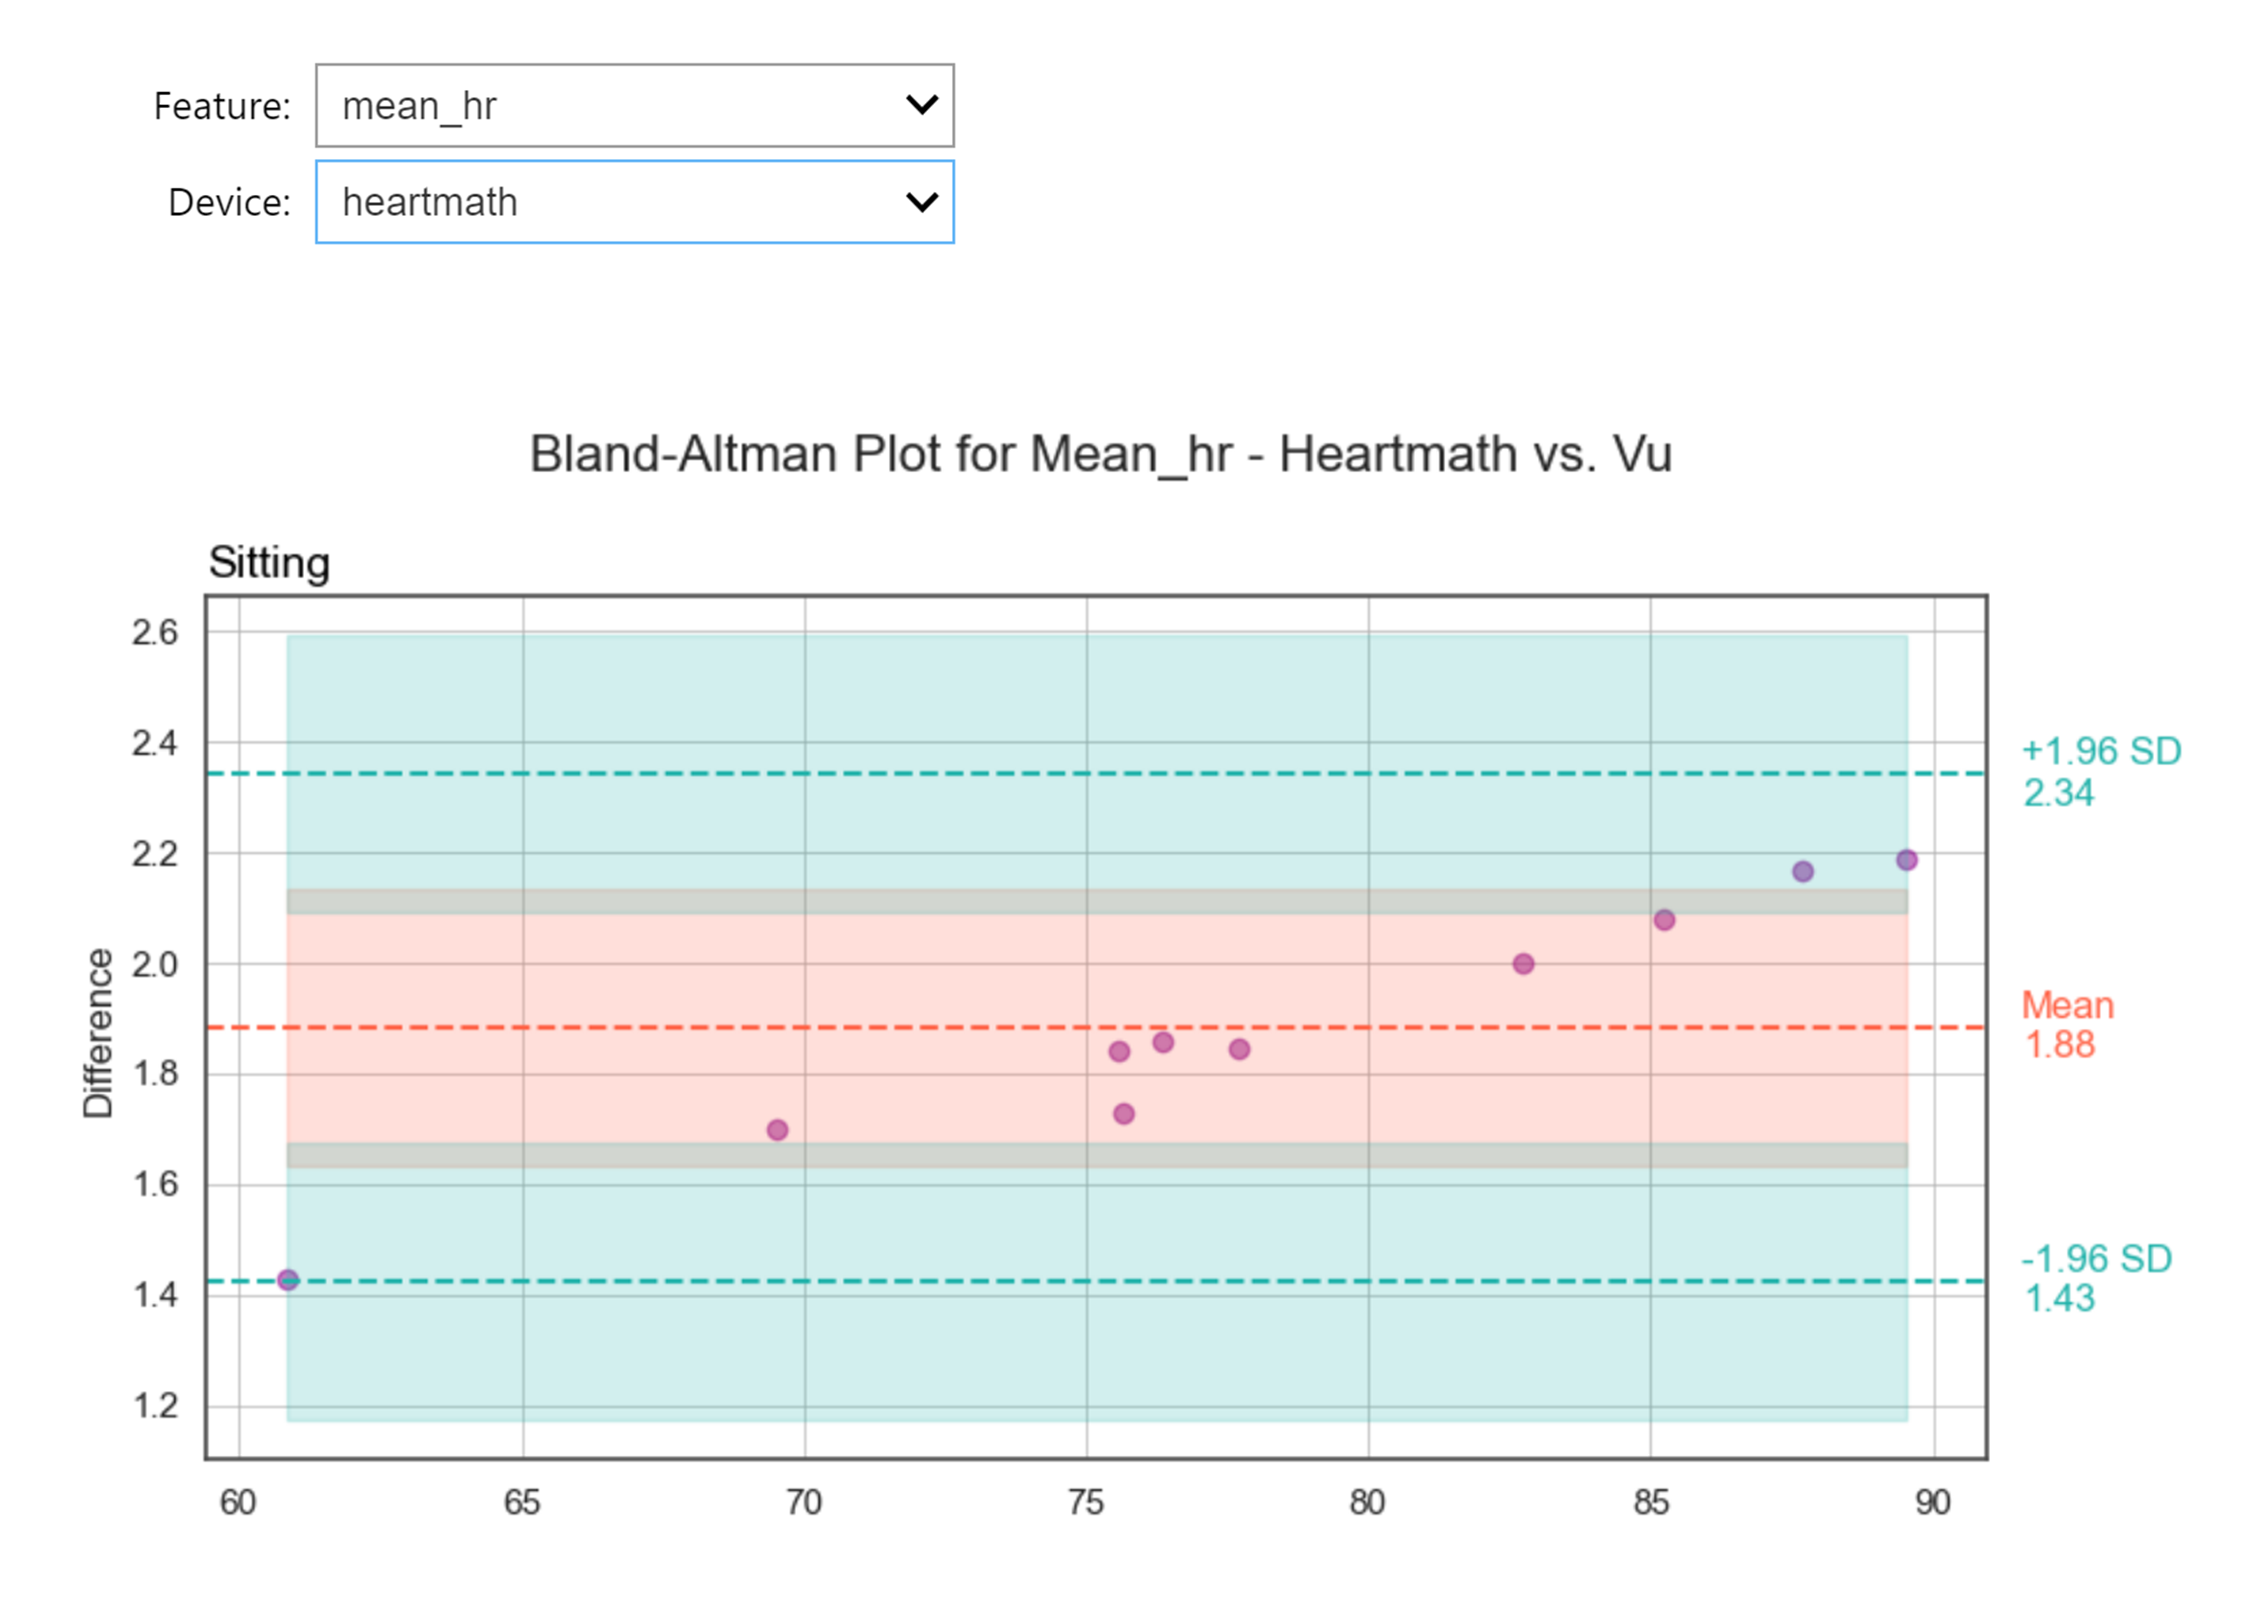
Bland-Altman Analysis
blandaltman_data = wearablehrv.group.blandaltman_analysis(data, criterion, devices, conditions, features, path, save_as_csv=False)
wearablehrv.group.blandaltman_plot(data, criterion, conditions, devices, features)
Descriptive Plots
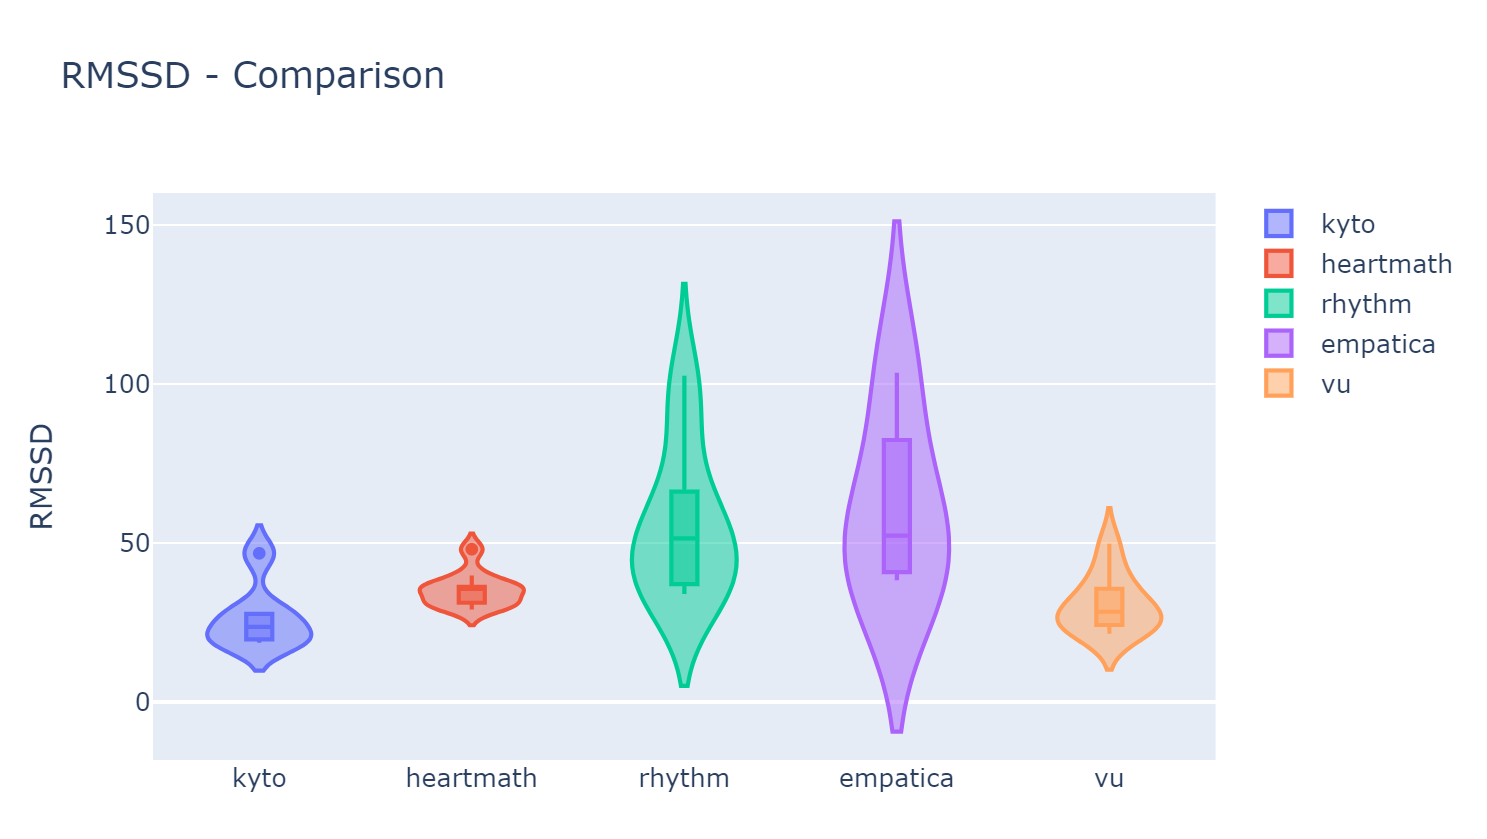
There are many options for you to meaningfully plot your group data and make an informed decision on the accuracy of your devices.
wearablehrv.group.violin_plot (data, conditions, features, devices)